8th May 2020
This is a personal ‘fact check’ of the first 25 minutes of Planet of the Humans, a documentary that is free to watch on YouTube. If you’ve watched the film, I’d suggest you spend a few minutes doing your own fact checking.
The film was made by Jeff Gibbs, with Michael Moore as executive producer. It currently (8th May 2020) has 57,420 comments. I’ve read a few, mostly thanking the film makers for exposing ‘the truth’.
I’m not an impartial viewer as I have worked in the low carbon/renewables sector for ten years or so. I don’t claim to be an expert in any single technology, but I have an MSc in advanced energy and environmental studies to back up my work experience, and therefore would guess I have more understanding of many of the subjects covered than the average viewer, but much less than real experts in each field. I do have the advantage of living in 2020, so can research what is happening now, while even the academics in the first part of the film have the disadvantage of having been interviewed some time ago.
I haven’t read any detailed reviews of the film in full – just one paragraph at https://www.eenews.net/stories/1063049841, in which Richard York admits that the section in the film in which he says that installation of renewables does not significantly reduce fossil fuel capacity is based on data that ends in 2009, and that it is probably no longer accurate. I don’t claim to have carried out extensive analysis of the claims made in the film and this is my own reading of ‘the truth’ we’re being told. I have included links to most of the information I’ve referenced.
My viewing and commentary have ended after 25 minutes of the film and I’ll probably now read some reviews. My thoughts so far are:
· Why are all the ‘stories’ presented so far from nine, ten or more years ago? Why are no dates displayed or mentioned in the film? It might not matter in a work of fiction, but this is supposed to be a documentary.
· Why, if this was such a vital issue to share with us gullible greenies, was the film not made available back in 2010, 2011 or 2012?
· Why is it free to watch on YouTube and why are they fundraising to promote the film? Were no distributors interested in sharing this vital message? Did they approach any distributors and what were they told if they did? Perhaps, ‘this looks like a bunch of old clips that you’ve cobbled together with no effort to verify or correct what’s said?’
· Why was no attempt made to bring things up to date as the film was being produced? Perhaps that happens later in the film, but spending 25 minutes covering events from around ten years ago seems pointless. If the film maker knows anything about renewables – and energy in general - he will know that we are in a very different place in 2019 and 2020.
· Why were none of the seemingly inaccurate and/or speculative statements made in the clips corrected? I’m sure that a film describing how things stood in 2019 and with errors and omissions corrected would be an entirely different watch.
· Whether the narrator really was as clueless about renewables as he appears to be at the start of the film. Did he really see ‘green energy not being what it appeared to be’ literally everywhere he looked (as he says in the film) and did he really think his message was strengthened by telling us that elephants failed to produce enough manure to power a zoo.
· Whether anyone really thought – or thinks – that technology will solve all of the issues relating to climate change. Why not point the finger elsewhere if you are concerned about: unsustainable levels of consumption (food, water, land, stuff etc.); population growth; governments incentivising people to have more children where populations are falling and/or ageing; global markets, economies and societies overly focused on growth and profit; governments giving tax breaks and incentives to industries that are looking for fossil fuels we can’t afford to use; habit destruction and mass extinction; inequality just about everywhere you look. Was renewable energy supposed to fix all of this? It’s good, but it’s not that good.
I started to read Richard Heinberg and David Fridley’s 2016 book ‘Our Renewable Future: Laying the Path for One Hundred Percent Clean Energy’ as Richard Heinberg is quoted in the film, presumably from several years before the book was published. I’ll continue reading that rather than watching the rest of the film. It appears to be a much better basis for discussion than this film, even if it is already a little out of date.
Solar PV, EVs and the Grid
After telling us we've known about the threat of climate change since the 1950s, the documentary starts with two stories (my description) relating to solar PV. The first is from pre-2009 (I assume, given that the narrative then talks about Obama coming to power) and the second from 2011.
The first story describes a 'solar festival' festival in Vermont that according to the narrator claimed to be powered by solar power. The film suggests organisers were furtively scuttling around to connect the site to the grid when it rained. I guess the narrator thought the organisers were trying to hoodwink people by making claims about the technology that weren't true. He also seemed to be implying that the festival was run partly on electricity generated by burning fossil fuels. Perhaps he wanted to make a point about the limitations of the technology – it’s true that it does not produce as much electricity in cloudy conditions, although it does usually produce some when it’s raining - the naivety/gullibility of the attendees, or both.
Did the narrator ask if the solar system at the festival had put any electricity into the grid when it wasn't raining? The organisers would have been naive or disingenuous to have claimed a 100% solar-powered festival (unless it ran only during daylight). Perhaps they meant that it would be 'net' 100% solar - putting some electricity into the grid and taking the same or a smaller amount back out. Perhaps the solar installation was just under-sized.
In any case, I don’t think any cheerleaders for solar PV were suggesting it was THE solution. Rather, it is part of the solution, and there seems little value in highlighting any of its limitations without looking at how it can contribute alongside everything else that is needed.
With the bigger picture in mind, it's likely that even at the time of the festival, Vermont wasn't using fossil fuels to any great extent in generating electricity.
https://www.instituteforenergyresearch.org/states/vermont/ (which appears to reference data from 2008, 2009 and 2010) says 'Vermont is one of just two states in the country without coal-generated electricity.' (70% nuclear, 20% hydro and 5% biomass) and https://www.eia.gov/state/?sid=VT says 'renewable resources—primarily hydropower—provided 99.7% of Vermont's electricity generation in 2018, the highest share for any state. In 2018, Vermont’s five utility-scale wind farms accounted for 17% of the state’s electricity net generation.'
So why not tell us how the ‘bad’ grid electricity used by the festival was generated? Why not add that ’99.7% of any electricity a similar festival would take from the grid in 2018 would have come from renewable resources’. Nuclear, hydro and biomass obviously aren’t uncontentious and come with their own issues, but this would seem like reasonable context to add.
The next story covers the launch of the Chevy Volt in 2011. It was charged from the grid, using the same supply as everyone else. There's a brief exchange with someone standing next to a charger, who seems to know very little about either the fuel source for the local electricity supply or the prospects for renewables. Someone from the supplier (Lansing Board of Water and Light) then states that around 95% of the electricity they supply is generated from coal.
This seems to be presented like it's a great revelation. How did the narrator think the EVs would be powered? Perhaps – by implication – he was making the valid point that the grid needed to be decarbonised.
BWL [Lansing Board of Water & Light] currently provides electricity to just under 100,000 customers in Michigan. It doesn't appear to be the most forward-thinking organisation, judging by its strategic plan (https://www.lbwl.com/about-bwl/strategic-plan), but recognises that 'The BWL faces many new environmental regulations, including those related to concern over climate change, such as the Clean Power Plan’. In 2015, they announced plans to close their largest coal-fired power station by 2020. Located in downtown Lansing, the power station has/had three 615ft tall chimneys, visible from 15 miles away (https://en.wikipedia.org/wiki/Lansing_Board_of_Water_%26_Light). If there are complaints about ‘industrial’ wind and solar, what is this?
There seems to be no detailed breakdown of fuel sources for electricity generation in Lansing, but coal was responsible for 33% of Michigan's electricity generation in 2019. 'In 2013, coal-powered plants generated roughly 50% of Michigan’s electricity. As of September of 2019, they are responsible for only 32.9%. Utilities and independent power plants are quickly moving away from coal as a primary energy source.' https://www.sciencemi.org/energy/alternating-currents-how-michigan-electricity-is-made/
Furthermore, while there’s concern about their plans to get there, 'Michigan's two big investor-owned utilities, Consumers Energy and DTE Energy, have both committed to meeting state-mandated clean energy targets and retiring coal plants by 2040.' https://www.greentechmedia.com/articles/read/michigan-regulators-order-dte-to-add-more-renewables-while-consumers-ups-clean-energy-targets.
It seems unlikely they will last that long (unless the market is heavily skewed for political reasons) as ‘building new wind and solar plants will soon be cheaper in every major market across the globe than running existing coal-fired power stations’ (https://www.theguardian.com/environment/2020/mar/12/wind-and-solar-plants-will-soon-be-cheaper-than-coal-in-all-big-markets-around-world-analysis-finds). That’s quite something and is worth repeating: in the study quoted by the article, ‘renewable power was [found to be] a cheaper option than building new coal plants in all large markets including Australia, and was expected to cost less than electricity from existing coal plants by 2030 at the latest. Solar photovoltaics and wind energy were already cheaper than electricity from about 60% of coal stations, including about 70% of China’s coal fleet and half of Australia’s plants’, it said.
Why doesn't the narrator tell us about the grid supply in 2018 or 2019 (assuming that's when the film was made)? Why doesn't he tell us how it is likely to change in the next few years?
Why did he not also talk about the benefits that switching to EVs would deliver for local air quality (including potential reductions in particulates from brake pads and tyres). https://uk-air.defra.gov.uk/assets/documents/reports/cat09/1907101151_20190709_Non_Exhaust_Emissions_typeset_Final.pdf
At 15-minutes in, the narrator visits a solar site that BWL have installed. It was built using thin-film modules with (according to the guide showing a group around the site) an efficiency of 8%, perhaps because ‘they are made in Michigan’, as the guide notes. The guide says they couldn’t afford the type of panels used by NASA, which cost ‘a million dollars per square inch’.
At the time that footage was shot, we had panels with an efficiency of over 20% (2.5 times the efficiency of the Michigan-made panels) installed on our house. https://us.sunpower.com/sites/default/files/media-library/data-sheets/ds-e20-series-327-residential-solar-panels.pdf?source=aw&awc=15762_1588947743_178a83074aef48fe3e44e5aea32a1412 .They are 327Wp SunPower panels of 61 x 41 inches – to use US measurements – and – assuming they cost around $400 including UK taxes when they were installed – that’s 0.000016% of the cost of the NASA panels (if indeed that NASA is paying). Just four of those panels and a 1.2 kW inverter can generate over 1000 kWh of electricity each year (even in the UK), between ¼ and 1/3 of an average UK household’s electricity consumption.
I’ve guessed at prices in 2010/11 – I haven’t had time to check the cost, but at the time the most efficient modules cost a little more than £1/Wp. There has been a 99% percent reduction in module costs since 1980 according to MIT (https://www.greentechmedia.com/articles/read/why-pv-costs-have-fallen-so-far-and-will-fall-further) and a 90% reduction in module costs in the 2010s alone (https://www.greentechmedia.com/articles/read/solar-pv-has-become-cheaper-and-better-in-the-2010s-now-what).
Thin-film panels have now reached efficiencies of over 20% in lab tests (https://www.britannica.com/technology/thin-film-solar-cell) and are available commercially at 17% efficiency (http://www.firstsolar.com/-/media/First-Solar/Technical-Documents/Series-6-Datasheets/Series-6-Datasheet.ashx).
Why does the narrator not mention that vastly more efficient panels were available at 0.000016% of the cost of the NASA panels that the guide referred to? Did he know so little about solar PV that he didn’t think to question the guide at the time? In any case, why does he not explain that the efficiency of panels (both thin-film and silicon-based) has increased since then, and that there has been an astounding drop in module prices since the footage was made? Surely this is relevant in any discussion about solar PV?
The person guiding visitors around the Lansing site then says (with some glee, it has to be said) that they generate around 63,000 to 64,000 units of electricity per year and he adds that they would need an array of 5 miles by 3 miles to power all 64,000 customers, who use an average of 6,000 units per year each.
64,000 kWh per year from that array (even at 8% and in Michigan) seems low. If they had used SunPower high-efficiency panels, they would have needed around 250 to hit that target, covering 400m2 – that’s around 5% of the size of a football pitch (or 15% if you allow for mounting on a single-axis tracking system, probably around the size of one penalty area. I’m not that familiar with tracker technology, but chose it because it requires more space than fixed-tilt mounting).
To provide the 384 GWh needed by the power-hungry residents of Lansing (at the time the film was made) I’ve quickly estimated – using some conservative assumptions - that you would need ca. 1.2M of these panels. If installed on single-axis trackers you might need just under 2.5 square miles. This would be a very large site, even by current standards, but this isn’t 15 square miles.
[64,000 customers @ 6 MWh/year = 384 GWh/year. Assuming a specific yield of 1000 kWh/kWp, that would require 384 MWp. 384 MWp = 327Wp x 1.17M panels. Panel area = 1.558m x 1.046m = 1.63m2, so total panel area = 1,913,700m2 or 0.74 square miles. Assuming a ground coverage ratio of 30% gives a total area of 2.46 square miles. It would be smaller with fixed-tilt mounting]
I’ve also checked some sites that have been constructed. ‘Solar Star is the largest solar farm in the US. When the farm was set up on June 2015, it was the biggest solar farm in the world. Solar Star has 1.7 million solar panels spread out in more than 13 square kilometres in Kern and Los Angeles Counties, California.’ That is just over 5 square miles. The site also uses high efficiency SunPower modules and has a rating of 747 MWp / 579 MW ac. So that is 747 MWp capacity in just over 5 square miles, meeting the needs of almost 255,000 households. https://en.wikipedia.org/wiki/Solar_Star
The lower efficiency Blythe Mesa site uses thin-film panels and has a capacity of 235 MWac (i.e. grid capacity, not DC capacity) in 2000 acres (3.12 square miles). https://en.wikipedia.org/wiki/Blythe_Mesa_Solar_Power_Project and Topaz Solar Farm has 550 MWac (again, not DC capacity) capacity of thin-film modules in 7.3 square miles. This was constructed between 2011 and 2014, and produces enough electricity to support 160,000 California homes, so would seem to be an excellent comparison to make with the hypothetical Lansing site https://en.wikipedia.org/wiki/Topaz_Solar_Farm. If 7.3 square miles of site can support 160,000 customers in California, ask yourself if a site built in Michigan at the same time would need 15 square miles to support 64,000 customers? Yes, I know California receives more solar energy than Michigan, but it’s only 5-6 kWh/m2/day v. 3-4 kWh/m2/day according to https://rredc.nrel.gov/solar/old_data/nsrdb/1961-1990/redbook/atlas/serve.cgi. The guide’s hypothetical site has 20% of the ‘customer per square mile’ ratio of a real site from the same time.
Why does the film not reflect the commercial reality at the time it was made rather than showing a site from 2011? The site itself looks like a deliberate effort on behalf of the energy company to bash the technology, and the ‘performance’ of the guide only adds to that suspicion. Might there have been vested local interests (in a town burning a lot of coal) that might have encouraged development of what looks like a poorly designed site? Now that would have been worth investigating.
Moving on, there is implied criticism of EVs because of the fuel sources used to generate electricity, and the implication that EVs in the USA are running on electricity generated almost exclusively from coal.
At the time of the interviews at the launch of the Volt, we can assume that roughly 12% of US electricity came from the renewables. In 2010, ‘renewable energy represent[ed] nearly 12% of total installed capacity and more than 10% of total generation’. https://afdc.energy.gov/files/pdfs/51680.pdf
We can also assume that when the film was being edited, that figure had increased to about 18%. In the US, ‘In 2019, about 63% of electricity generation was from fossil fuels—coal, natural gas, petroleum, and other gases. About 20% was from nuclear energy, and about 18% was from renewable energy sources. The U.S. Energy Information Administration estimates that an additional 35 billion kWh of electricity generation was from small-scale solar photovoltaic systems in 2019’. https://www.eia.gov/tools/faqs/faq.php?id=427&t=3
Coal use in the USA decreased (as a percentage of fuel use for electricity generation) from 39% in 2014, to 30% in 2017 and 24% in 2019. https://en.wikipedia.org/wiki/Coal_power_in_the_United_States#Trends,_comparisons,_and_forecasts
Perhaps this is mentioned later in the film, but I think it would have been worth saying in the film: on average, an EV driver in the USA in 2019 would be using electricity that was generated from renewables (18%) and nuclear (20%) as well as fossil fuels (63%). It’s not where we need to be, but very different from the implication that EVs are powered almost exclusively by coal. Many early EV adopters also have residential solar (especially in the UK), so the ‘real world’ energy mix for EVs would probably have a higher percentage of renewable energy.
I appreciate the UK is in a different stage of the energy transition to the USA, but you’d hope a similar film made in the UK would have noted that the carbon emissions per kWh of electricity supplied by the grid (carbon intensity) have fallen significantly, even over the past 6 years (primarily through reduction in coal-fired generation from 30% in 2014 to 2% in 2019 and an increase in renewables). Since 2012 this has dropped from over 500 g CO2/kWh to under 200 g CO2/kWh.

The drop in the last section of the line on the graph is largely because last month (April 2020), the UK saw an all-time record for solar power generation (9.68 GW was reached on April 20th) with solar power covering nearly 30% of UK electricity consumption. https://renewablesnow.com/news/uk-breaks-peak-solar-generation-record-as-pollution-levels-drop-695856/.
At times in the month, wind and solar were providing around 70% of all UK electricity consumption. Demand has dropped since the lock down started, but that's still impressive. At the same time, the UK also broke the period for the longest time without using coal for electricity generation (breaking the record of 18 days on 28th April). The run is now 25 days plus and counting. We are back at levels (for coal-fired generation) last seen in the 1880s. https://www.theguardian.com/business/2020/apr/28/britain-breaks-record-for-coal-free-power-generation.
Wind
At 16 minutes in there is an interview with someone erecting a wind turbine. He reels off various figures, including that the base requires ‘800 yards of concrete’.
The film then moves to Lowell Mountain in Vermont, where there has been ‘mountain top removal’ for 21 wind turbines. It does look pretty shocking. There is information about this development at https://legislature.vermont.gov/Documents/2020/WorkGroups/House%20Natural/Wind%20Power/W~Robert%20Dostis~Kingdom%20Community%20Wind%20Quick%20Facts%20for%202019~2-21-2019.pdf
It appears this footage dates from around 2010 (if construction took 18 months and they were operational in 2012). The turbines required 11% of the concrete referred to in the earlier section (90 yards), but this wasn’t mentioned. I’m not suggesting that concrete is desirable, just that there is no attempt to correct the likely assumption that we’re seeing a site requiring 800 yards of concrete per turbine.
There’s also no correction of the statement that the turbines will have a lifetime of 20 years. These turbines have a guarantee for 25 years and are expected to be in use longer than that.
One interviewee says ‘this is not the legacy I want to leave my children’ while the screen shows the construction site. You can see the construction at https://www.youtube.com/watch?v=kRIB83_WNfA. 135 acres was apparently impacted during construction, with 45 acres ‘re-vegetated using native plants and mulch produced from the project itself.’
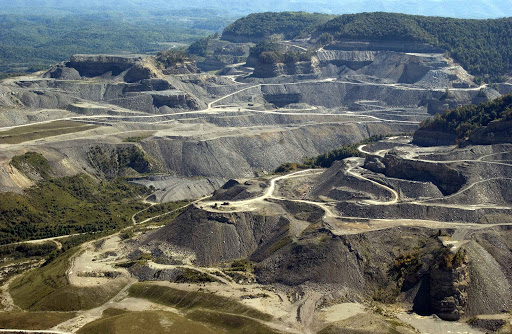
The legacy is surely not the construction site, but the working turbines and the partly re-vegetated land. There is a reference that this is like mountain top removal for coal. There is a fleeting view of an open-cast coal mine at 20:45 into the film, but no examination of its environmental impact and legacy. Google https://en.wikipedia.org/wiki/Mountaintop_removal_mining. Is what you see with the wind turbine site anything like the pictures of worked out open-cast coal mines?

Is the wind site industrial? It’s not natural, certainly. But what are the alternatives? [Just as I’d ask the people of Bournemouth who objected to the Navitus Bay wind array on the grounds that the turbines – miles out from the coast and barely visible – would destroy the town’s tourist industry, would you rather have a coal-fired power station or nuclear power station in the town … or would you prefer not to take responsibility for the source of your power at all?]
A connection is made by one interviewee between Green Mountain Power and Gaz Métro, a ‘leading Quebec energy company’, who are described as having a link to ‘exploiting tar sands’ in Canada.
Gaz Métro was renamed Énergir in 2017. Looking at https://en.wikipedia.org/wiki/%C3%89nergir there is no indication that the company (pre- and post-name change) has ever been involved in exploiting tar sands. Their activities are in natural gas, biomethane, wind, solar and hydropower (I can’t see a breakdown, but I assume it is mostly focused on natural gas).
Would you expect the statement that the wind farm owner is associated with tar sands exploitation to be corrected (and I’m happy to be corrected if there is a connection)?
In any case, if a simple connection with the tar sands industry is so shocking, why not make a film about the damage it causes to the environment as a result of extraction, refining, transportation and fuel use?
Again, no-one with any sense is suggesting that wind is THE solution, but it needs to be part of the solution, at least for the lifetime of sites being installed now.
Is the narrator’s beef with those who pay for and own the renewables? Is it a shocking revelation that investors will want to make a return on their investment, or should we expect money to be gifted to install renewables, while fossil fuel companies invest billions, underpinned by tax breaks, to exploit oil, gas and coal reserves that we cannot afford to use without pushing the planet towards ever higher temperatures and sea levels? Which is the bigger issue?
It is stated (by someone who calls the wind developer ‘scum’) that ‘you have to have a fossil fuel plant backing it up, idling 100% of the time’ and that ‘cycling the reserve up and down generates a bigger carbon footprint than if you ran it straight [sic]’. Both statements appear to have been incorrect at the time and are certainly incorrect now.
I’m not claiming to be an expert, but I know that having operating reserves in electricity networks to meet demand if there is disruption to supply is not new. This can be ‘spinning reserve’ (generators already operating that can increase power output at short notice) and ‘standing’ or ‘supplemental’ reserve associated with fast-start generators. Dinorwig’s pumped hydro generator, commissioned in 1984, can go from 0 MW to 1,320 MW in 12 seconds, for example (https://www.electricmountain.co.uk/Dinorwig-Power-Station). There is usually further reserve capacity that can be brought online in a longer period to relieve spinning and supplemental reserve.
Back in 2008, the UK’s Economic Affairs Committee noted that any back-up for renewable energy generation on the grid would mostly be standing reserve (i.e. not spinning reserve). (https://publications.parliament.uk/pa/ld200708/ldselect/ldeconaf/195/19507.htm).
Things have moved on since then and the UK can call on interconnectors to help balance supply and demand. There are three or four in operation (https://www.nationalgrid.com/sites/default/files/documents/P2270%20Connecting%20for%20a%20smarter%20future%20final%20med%20res.pdf says four, https://www.nationalgrid.com/group/about-us/what-we-do/national-grid-ventures/interconnectors-connecting-cleaner-future says three), connecting the UK with Ireland, France, Belgium and the Netherlands, three more in construction, an additional connection with France and connections with Norway and Denmark, and three more in development, providing a connection with Iceland as well as further connections with Belgium and the Netherlands (https://www.nationalgrid.com/group/about-us/what-we-do/national-grid-ventures/interconnectors-connecting-cleaner-future).
You can see how these are used if you look at the Grid Carbon phone app. At 8am on 7th May 2020 we are importing 1.8 MW from France, 0.9 MW from both the Netherlands and Belgium, and 0.5 MW from Ireland. At 4pm on 7th May 2020, with solar generating 27% of the UK’s electricity, we’re importing under 2 MW in total from Belgium, Netherlands and France. That’s not to say there aren’t any additional reserves. Powersystemsuk, a specialist in this field notes ‘Fuel types to power the Short Term Operating Reserve (STOR) prime movers have evolved over the years, from Diesel to more environmentally Bio-Diesels, Natural Gas and Bio-Gas’. (https://www.powersystemsuk.co.uk/sectors/stor/).
In the USA there are ‘three main interconnections, which operate largely independently from each other with limited transfers of power between them’ (Eastern, Western and ERCOT). It appears there are also interconnectors linking to Alaska and Quebec (which I know is in Canada!). (https://www.eia.gov/todayinenergy/detail.php?id=27152). Balancing Authorities are responsible for operation of the grid their role includes managing transfers of electricity with other balancing authorities.
We will increasingly see storage used to improve the efficiency of the grid and to add resilience, balancing capacity and perhaps baseload at night. The most notable existing example – if you exclude pumped ‘storage’ like Dinorwig - is the Tesla Megapack, ‘a grid energy storage battery with a capacity of up to three megawatt hours designed for battery storage power station use. Groups of Megapack units working together are designed to operate like the ‘Tesla big battery’ installed at the Hornsdale Power Reserve in Australia during 2017 and displacing fuel-based peaking power-generation facilities.’ (https://en.wikipedia.org/wiki/Tesla_Megapack). As a sign of the reducing costs and improving efficiencies, Tesla has approval to build a battery power plant at Moss Landing in California that will be approximately ten times bigger than the Hornsdale Power Reserve, which in turn was three times bigger than any other battery storage facility when it was built. (https://cleantechnica.com/2020/02/27/humongous-tesla-battery-plant-approved-in-california-is-10x-bigger-than-worlds-biggest-battery-plant/).
There is significant investment in R&D and production in the battery and storage sector and the ‘global energy storage market will grow to a cumulative 942GW by 2040, attracting a whopping $620 billion in investments’. (https://about.bnef.com/blog/energy-storage-620-billion-investment-opportunity-2040/).
As electric vehicle numbers increase, the grid will be able to utilise batteries as additional storage. ‘Vehicle-to grid, also known as vehicle-grid integration (VGI), could help to make an energy grid more resilient by supplying electricity during times of peak use. That includes when renewable energy resources are unavailable, such as at night when solar panels aren't working but plenty of vehicles are sitting idle.’ https://www.greenbiz.com/article/vehicle-grid-technology-revving also notes that in 2018 a company called Enel X used 6,000 residential EV chargers and others to create a 30 MW ‘virtual battery’ that could supply the grid in California. ‘The company projects that by 2025 a JuiceNet virtual battery could provide the equivalent energy of 47 natural gas power plants, once 3 million EVs are on U.S. roads.
In any case, it is not necessary to have ‘spinning reserve’ backing up 100% of wind turbine output, as was stated in the film. I would doubt it was true when the footage was shot and certainly wasn’t true when the film was being produced. Why was there no correction to this statement? Why no reference to the use of batteries and other technologies for grid storage and the potential for EVs to provide storage capacity when not being used? I assume that correcting these statements would undermine the argument the filmmaker is making.
Hydrogen, ethanol and elephant poo (?!)
At 21 minutes, the narrator says that ‘everywhere I encountered green energy, it wasn’t what it seemed’. Perhaps if he’d looked more widely he might have reached a different conclusion. Or perhaps he has a selective memory and only remembers these examples; can it be true that literally ‘everywhere’ he encountered green energy it wasn’t what it seemed? If so, I wonder what he thought it was.
The next clip (undated) includes a statement that the hydrogen being used to power a car can come from any hydrocarbon source. While true, it’s equally true that hydrogen can come from water. Why no mention of that?
In March of this year, Los Angeles announced plans to use ‘renewable hydrogen’ (hydrogen produced using renewable energy) to replace 1,900 MW of coal-fired power generation – they will transition via natural gas in 2025 to hydrogen by 2045. The chief executive officer of Mitsubishi’s America’s unit said that burning 100% hydrogen in the gas-fired turbines will take some work, but added that “we are going to get there before 2045. We definitely think it’s possible to get there in 10 years or less.” (https://www.bloomberg.com/news/articles/2020-03-10/l-a-aims-to-be-first-to-power-u-s-city-with-renewable-hydrogen)
It is true that there is no realistic prospect of renewables being used to generate the hundreds of millions of tonnes of hydrogen that might be needed for transport, heating and industrial processes, so we will need to be selective with its use, reduce our demand for power and use other solutions for storage.
The second example he uses is a zoo that claimed to be powered by elephant manure, where the elephants apparently didn't even produce enough poo to heat their own environment. Is that a serious example of ‘green energy’ failing to meet expectations? I’m almost beginning to think the film is an elaborate joke.
The third example is ethanol, produced here using coal and corn. He is right in this case. It is not a green fuel.
Do renewables reduce fossil fuel use?
At 22 minutes in, the tone and content appear to become more serious.
First there’s a brief clip of Richard Heinberg, who says ‘I’ve counted something like 25 alternative energy options’ and that ‘we’re getting, in some cases, no energy from these potential options’. So, in many cases we are getting energy? Is there any suggestion we need 25 alternative sources of energy? Why not tell us which ones don’t work and we can consider whether that’s a problem or not – rooftop wind turbines aren’t a sensible idea, for example, but we don’t need them.
When was this clip filmed? Given the rest of the footage I’ve seen seems to date from 2008-2012, perhaps this is not an accurate picture of alternative energy when the film was being produced.
In Richard Heinberg and David Fridley’s 2016 book ‘Our Renewable Future: Laying the Path for One Hundred Percent Clean Energy’ (which from a brief read appears to be very balanced and well researched, if already a little out of date), it is noted ‘Solar and wind are growing fast. In 2014, global solar capacity grew 28.7 percent over the previous year and has more than quadrupled in the past four years. This is an astounding rate of growth: if it were to continue, solar would become the world’s dominant source of electricity by 2024’. (https://ourrenewablefuture.org/chapter-3/). It doesn’t appear that Richard Heinberg thinks that alternative energy is a write off, as implied by the brief clip included in the film.
Next is a clip in which Richard York, professor of sociology and environmental studies at the University of Oregon, states that there is no real evidence that countries that install renewable energy capacity reduce fossil fuel generating capacity. His research is from 2012 and he has since confirmed that his data sample ends in 2009. He has said (https://www.eenews.net/stories/1063049841) "There's legitimate reason to think the data may have changed in the last decade. In the period I analyzed, nations have not made serious efforts to suppress fossil fuel production. But over the past decade, there have been more serious efforts."
This is clearly the case in the UK (and I’m fighting the urge to say ‘where there has been lukewarm Government support at best’), where the carbon intensity of the grid has reduced from over 500 g CO2/kWh to under 200 g CO2/kWh since his research was published. Yes, this is in no small part to a switch from coal to natural gas, but renewables are also contributing to the fall.
In the UK, ‘2019 was a record year for renewable electricity generation which increased by 8.5 per cent compared to 2018, from 110 TWh to 119 TWh, largely due to increased capacity. Renewables’ share of electricity generation was a record 36.9 per cent and an increase of 3.8 percentage points on the 33.0 per cent share in 2018. This reflects the higher renewable generation and lower overall electricity generation in 2019, compared to 2018.’ https://assets.publishing.service.gov.uk/government/uploads/system/uploads/attachment_data/file/875410/Renewables_Q4_2019.pdf
https://www.carbonbrief.org/analysis-why-the-uks-co2-emissions-have-fallen-38-since-1990 states that UK emissions have fallen from around 600m tonnes of CO2 in 1990 to 367 MtCO2 in 2017. ‘If underlying factors driving emissions had not changed, Carbon Brief’s analysis shows that a growing population and a constant electricity generation mix would have led to emissions increasing by around 25% compared to 1990 levels. Instead, emissions actually fell by 38% to 367MtCO2.’
The increase in renewables capacity has clearly contributed to a reduction in CHG emissions, which is surely all you can expect the sector to do.
In the USA, as noted above, coal use for electricity generation dropped from 39% to 24% between 2014 and 2019, or 23% in 2019 if you look at https://www.eia.gov/energyexplained/electricity/electricity-in-the-us.php. Yes, natural gas use has increased – primarily because of shale gas extraction, but overall the fossil fuel mix in the USA’s electricity supply has decreased each year since 2010 (apart from an uptick in 2018, followed by a decrease in 2019).
‘Before 2005, US carbon emissions – from all sectors - were marching upwards year after year, with little sign of slowing down. After this point, they fell quickly, declining 14% from their peak by the end of 2016. [The reductions] were driven by a number of factors, including a large-scale transition from coal to gas, a large increase in wind power, a reduction in industrial energy use and changes in transport patterns’. (https://www.carbonbrief.org/analysis-why-us-carbon-emissions-have-fallen-14-since-2005).
Again, and with apologies for the repetition, the increase in renewables capacity has clearly contributed to a reduction in CHG emissions. Why does the film not tell us what was happening when it was being produced? This seems to be a deliberate strategy to misinform and it is the only common thread in the first 25 minutes of the film.
After 23 minutes, Nina Jablonski from Penn State University says, and I quote the start ‘the story that we’re in right now is, okay, we’re in ecological hot water, but there are technological fixes, and if we’re just creative enough, if we’re just ingenious enough, and we just work hard enough, we will triumph’. Whose story is this? Does anyone really think that technological fixes can solve all the issues associated with over-consumption, habitat destruction, climate change, inequality etc. etc.? It’s seems as odd as expecting aspirin to rid the world of malaria or coronavirus.
At 24 minutes, Ozzie Zehner, says that ‘alternative technologies, like wind and solar’ are no different from fossil fuels. He seems to have been most active in attacking renewables around 2012, but there’s no indication of when the footage was filmed.
He then explains that solar cells are not made from sand. This is not news to anyone who knows anything about production of silicon for solar cells, or indeed for electronics. The manufacturing of solar cells, modules, cables, inverters and mounting systems – as well as wind turbines - involves resource and energy use. Where did people think they came from?
Surely the question we should ask is how this compares with alternatives? Research in 2017, referenced at https://www.carbonbrief.org/solar-wind-nuclear-amazingly-low-carbon-footprints, notes that ‘Building solar, wind or nuclear plants creates an insignificant carbon footprint compared with savings from avoiding fossil fuels’. This research looked at the full lifecycle GHG emissions for a range of electricity sources up to 2050. ‘It shows that the carbon footprint of solar, wind and nuclear power are many times lower than coal or gas with carbon capture and storage (CCS). This remains true after accounting for emissions during manufacture, construction and fuel supply.’
‘For coal and gas, these lifecycle energy uses and emissions come from extraction, machinery and fuel transport. Significantly, they also come from methane leaks at pipelines, well heads or coal mines. These lifecycle emissions continue, even if coal or gas plants add CCS, which also may not capture 100% of emissions at the power plant.’
The study concluded that ‘one unit of energy invested in coal power yields nine units of electricity. Nuclear power is twice as good as coal, with the energy embedded in the power plant and fuel offsetting 5% of its output, equivalent to an EROI (Energy Return on Investment) of 20:1. Wind and solar perform even better, at 2% and 4% respectively, equivalent to EROIs of 44:1 and 26:1.’
Similar results, published by the Intergovernmental Panel on Climate Change (IPCC) in 2014, show solar had a carbon footprint of 41-48 gCO2/kWh and wind around 11-12 gCO2/kWh, with gas at 490 gCO2/kWh and pulverised coal at 820 gCO2/kWh.
Since 2014, there have been improvements in silicon and thin-film module efficiency, extensions to module performance guarantees and commercialisation of bi-facial panels, which are both more durable and more efficient.
Calculating a carbon footprint for solar panels must make some assumption about their operating life. The least generous manufacturers guarantee that their products will produce at least 80% of their initial output after 25 years and performance guarantees are now extending to 30 years (offered by JA solar - https://www.jasolar.com/uploadfile/2018/0518/20180518102313951.pdf - and others). If you keep solar panels operating past 25 and 30 years the carbon footprint per kWh will reduce.
Manufacturers are taking advantage of increased efficiencies and bifacial designs to deliver much larger capacity modules (some over 500Wp - https://www.pv-tech.org/news/trina-solar-betting-on-largest-wafer-size-and-third-cut-cells-for-500w-plus), so reducing the amount of material and energy used in making frames and mounting kit.
First Solar has been recognised for producing modules with a carbon footprint of 11-17 g CO2/ kWh) and an energy payback time of less than 6 months (https://www.pv-magazine.com/2019/12/05/the-sustainability-game-changers/) and the industry is continually looking to reduce the carbon and water footprint of its products.
Comparing wind and solar with fossil fuels in 2020 (or whenever the film was produced) is pretty outrageous when carbon footprints can now be 2% or 4% of that of coal and gas (ca. 20 g CO2/ kWh compared with 820 g CO2/ kWh and 490 g CO2/ kWh). How can you claim they are equivalent?
There seems little point in continuing to watch a film that is presenting unsubstantiated statements as ‘facts’. Sadly it already seems to be providing the ‘windmill’ and solar bashing brigade with ammunition. The end result, though, is likely to be to increase the resolve of those who fund, design, build and maintain renewables. After all, we’re used to being underdogs.